Trick #2: Incorporating tech.
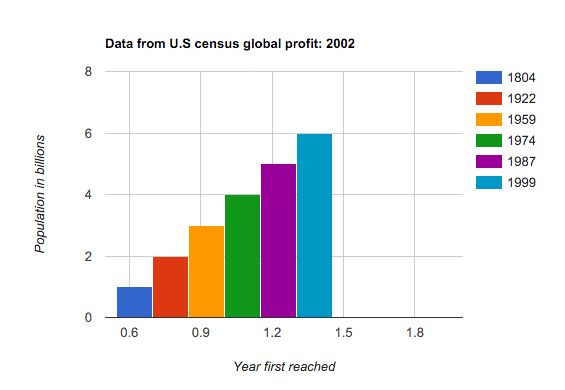
Today we worked to use different types of graphs to represent data. Because my student does not get exciting over physically drawing out graphs, I typically try to incorporate a tech aspect. This week we used a site called Rapid Tables to create three separate graphs representing the years in which the world population reached 1 billion, 2 billion, etc.
We began by using the site to create a bar graph, but realized that this was not the most effective way to represent this data.
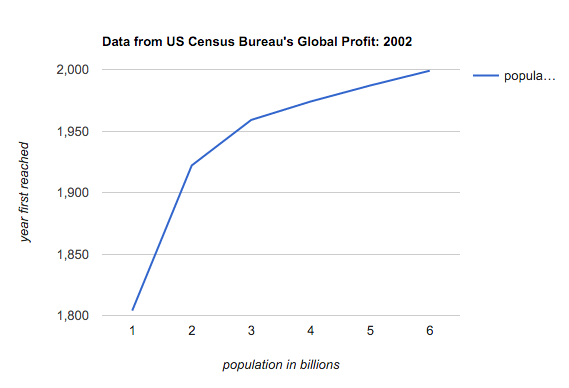
We then changed to a line graph, and although the information could have been represented in a much more clear way, the graph is still accurate and my student was able to create it with more confidence.
Getting a little excited, my student decided to try to represent the data using a pie graph.
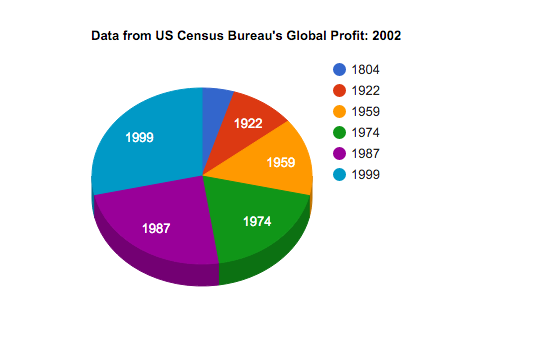
We had a good discussion about this graph and decided that this is not a very effective means of representing this data, because it is challenging to display the variables.
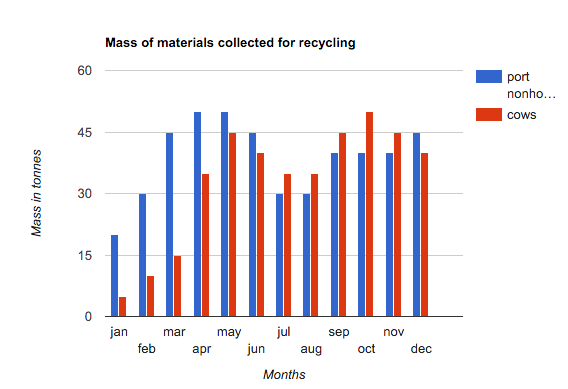
After gaining some confidence using the program, we were able to effectively construct a double bar graph to compare the hypothetical recycling programs of two cities.
*Although the city was not really called "cows" but instead "Cowling" I like to encourage my student to have fun while learning math, and if he is able to laugh about something like this, I am all for it!
I would definitely recommend using Rapid Tables in the future. It is very comprehensive to use, and after a few moments of trial and error we were able to develop some effective graphs. I feel that the strategy of creating online graphs has worked very well to engage my student. He seems much more comfortable using tech than drawing out graphs, and I have found that when he is more comfortable we are able to accomplish much more learning, and develop better meaning of what he is creating.
 RSS Feed
